In this interactive element, you will get a chance to explore the data from Wulff et al.'s (2018) meta analysis in order to better understand the processes underlying decisions from experience. Some researchers have tried to understand this decision with Tversky and Kahneman’s (1992) cumulative prospect theory (CPT) (see Chapter 7 and 8)–this element allows you to do the same. So this element allows you to try to model the data with cumulative prospect theory.
To do this, you will control the exploration and decision making of 10,000 simulated decision makers with the goal to match the aggregate decisions observed in the data. There are several parameters you can adjust to try and match the aggregated decisions in the observed data. The adjustments are done with the sliders below. Each adjustment will automatically update the plot on the right. We explain each of the parameters below its slider element.
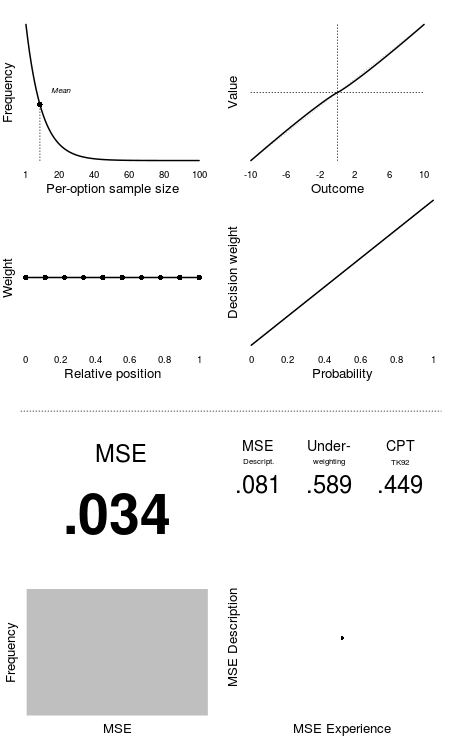
Your main target is to find a combination of these parameters that minimizes the mean squared error (MSE) in predicting the true choice proportions across all observed decision problems that include a safe and a risky option. The MSE value will be visible at the bottom. In addition, the figure presents the MSE in predicting decisions from description, given the same parameters.
Try to find a combination of the parameters to calculate a MSE under 0.02.
Note: to get a better intuitive feel for what the alpha, lambda, and gamma, parameters of prospect theory do, please see Chapter 8's interactive element.
In decisions from experience, people have to sample from each option so you need to determine the average (per-option) sample size each agent takes.
This controls an individual's sensitivity to payoffs (alpha: 0 (low sensitivity to payoffs) - 2 (very high sensitivity)).
This controls an individuals loss aversion (lambda: 1 (loss neutral) - 3 (very loss averse))
This controls how sensitive people to changes in probability and consequently the degree to with they overweight or underweight rare events (gamma: 0 (overweighting) - 2 (underweighting))
This controls how much weight each observed sample gets and whether early samples get more weight (primacy), later samples get more weight (recency), or they get equal weight (recency: -1 (primacy) - 1 (recency)).
This controls the amount of random noise added to the outcomes (0 (no noise) - 1 (large noise)).