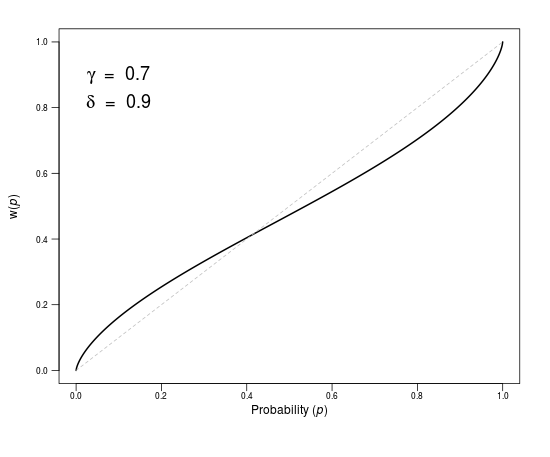
In this interactive element for Chapter 8, you can experience cumulative prospect theory’s (CPT, Tversky & Kahneman, 1992) weighting function. It translates probabilities into subjective decision weights. As described in Box 8.1 in Chapter 8, a frequently used formalization of the weighting function (Goldstein & Einhorn, 1987) has two parameters that separate the curvature of the weighting function (via the probability sensitivity parameter γ) and its elevation (via the elevation parameter δ). In the figure below, you can visualize the shape of the weighting function for different values of these parameters (the purpose of the parameters φ and α is described below).
Probability-weighting function
Learning task
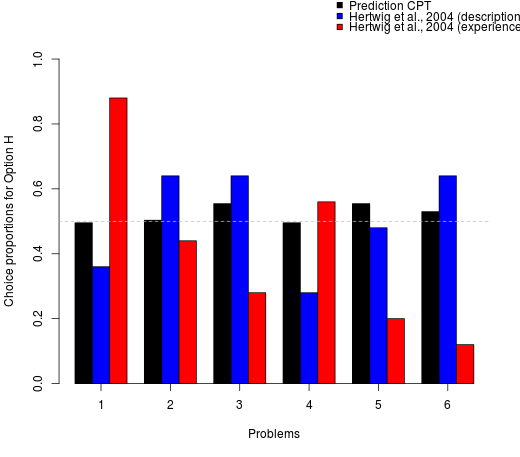
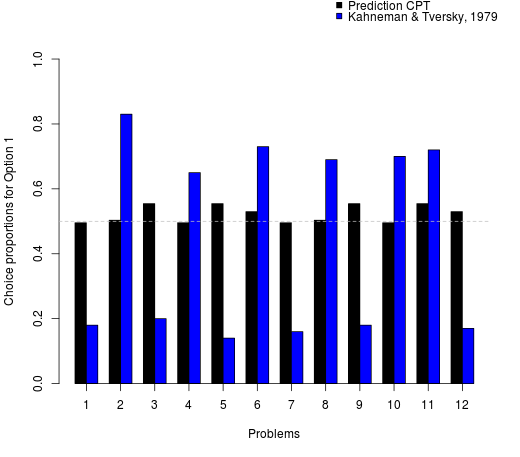
Adjust the parameters of CPT so that they capture as closely as possible the observed choice proportions of Hertwig et al. (2004; description condition). Do the same for the observed choice proportions of Hertwig et al. (2004; experience condition) and the choice proportions of Kahneman and Tversky (1979).
- Hertwig et al. (description): Gamma , Delta , Phi , Alpha .
- Hertwig et al. (experience): Gamma , Delta , Phi , Alpha .
- Kahneman & Tversky: Gamma , Delta , Phi , Alpha .
In order to arrive at predicted choice probabilities, also values for CPT’s value function as well as a probabilistic choice rule are required. The value of the parameter for the curvature of the value function (α parameter) and for the choice sensitivity parameter of the softmax choice rule (φ parameter) can be adjusted via the respective sliders above. The left and right panels below show the resulting choice proportions predicted by based on the set of parameters CPT (black bars) for the six choice problems in Hertwig, Barron, Weber and Erev (2004) and the 12 choice problems in Kahneman and Tversky (1979), respectively. The empirical choice proportions (aggregated across participants) observed in these studies are shown in the blue and red bars. The choice problems themselves are reported below the two panels.
The choice problems for Hertwig et al. (2004)
|
Outcome 1
|
Probability 1
|
Outcome 2
|
Probability 2
|
Outcome 1
|
Probability 1
|
Outcome 2
|
Probability 2
|
|
|---|---|---|---|---|---|---|---|---|
| Problem 1 | 4 | 0.8 | 0 | 0.2 | 3 | 1 | 0 | 0 |
| Problem 2 | 4 | 0.2 | 0 | 0.8 | 3 | 0.3 | 0 | 1 |
| Problem 3 | -3 | 1 | 0 | 0 | -32 | 0.1 | 0 | 0 |
| Problem 4 | -3 | 1 | 0 | 0 | -4 | 0.8 | 0 | 0 |
| Problem 5 | 32 | 0.1 | 0 | 0.9 | 3 | 1 | 0 | 0 |
| Problem 6 | 32 | 0.03 | 0 | 0.98 | 3 | 0.3 | 0 | 1 |
| Option H | Option L | |||||||
The choice problems for Kahneman & Tversky (1979)
|
Outcome 1
|
Probability 1
|
Outcome 2
|
Probability 2
|
Outcome 3
|
Probability 3
|
Outcome 1
|
Probability 1
|
Outcome 2
|
Probability 2
|
Outcome 3
|
Probability 3
|
|
|---|---|---|---|---|---|---|---|---|---|---|---|---|
| Problem 1 | 2500 | 0.33 | 2400 | 0.66 | 0 | 0.01 | 2400 | 1 | 0 | 0 | 0 | 0 |
| Problem 2 | 2500 | 0.33 | 0 | 0.67 | 0 | 0 | 2400 | 0.34 | 0 | 0.66 | 0 | 0 |
| Problem 3 | 4000 | 0.8 | 0 | 0.2 | 0 | 0 | 3000 | 1 | 0 | 0 | 0 | 0 |
| Problem 4 | 4000 | 0.2 | 0 | 0.8 | 0 | 0 | 3000 | 0.25 | 0 | 0.75 | 0 | 0 |
| Problem 5 | 6000 | 0.45 | 0 | 0.55 | 0 | 0 | 3000 | 0.9 | 0 | 0.1 | 0 | 0 |
| Problem 6 | 6000 | 0.001 | 0 | 0.999 | 0 | 0 | 3000 | 0.002 | 0 | 0.998 | 0 | 0 |
| Problem 7 | 1000 | 0.5 | 0 | 0.5 | 0 | 0 | 500 | 1 | 0 | 0 | 0 | 0 |
| Problem 8 | -1000 | 0.5 | 0 | 0.5 | 0 | 0 | -500 | 1 | 0 | 0 | 0 | 0 |
| Problem 9 | 6000 | 0.25 | 0 | 0.75 | 0 | 0 | 4000 | 0.25 | 2000 | 0.25 | 0 | 0.5 |
| Problem 10 | -6000 | 0.25 | 0 | 0.75 | 0 | 0 | -4000 | 0.25 | -2000 | 0.25 | 0 | 0 |
| Problem 11 | 5000 | 0.001 | 0 | 0.999 | 0 | 0 | 5 | 1 | 0 | 0 | 0 | 0 |
| Problem 12 | -5000 | 0.001 | 0 | 0.999 | 0 | 0 | -5 | 1 | 0 | 0 | 0 | 0 |
| Option 1 | Option 2 | |||||||||||